Monitoring Booster
Real-time machine data for predictive maintenance.
Monitoring Booster combines Grafana, Prometheus and OpenTelemetry to give manufacturers full visibility across machines, sensors and IT systems. Monitor live data, detect anomalies early and plan maintenance before failures disrupt production.
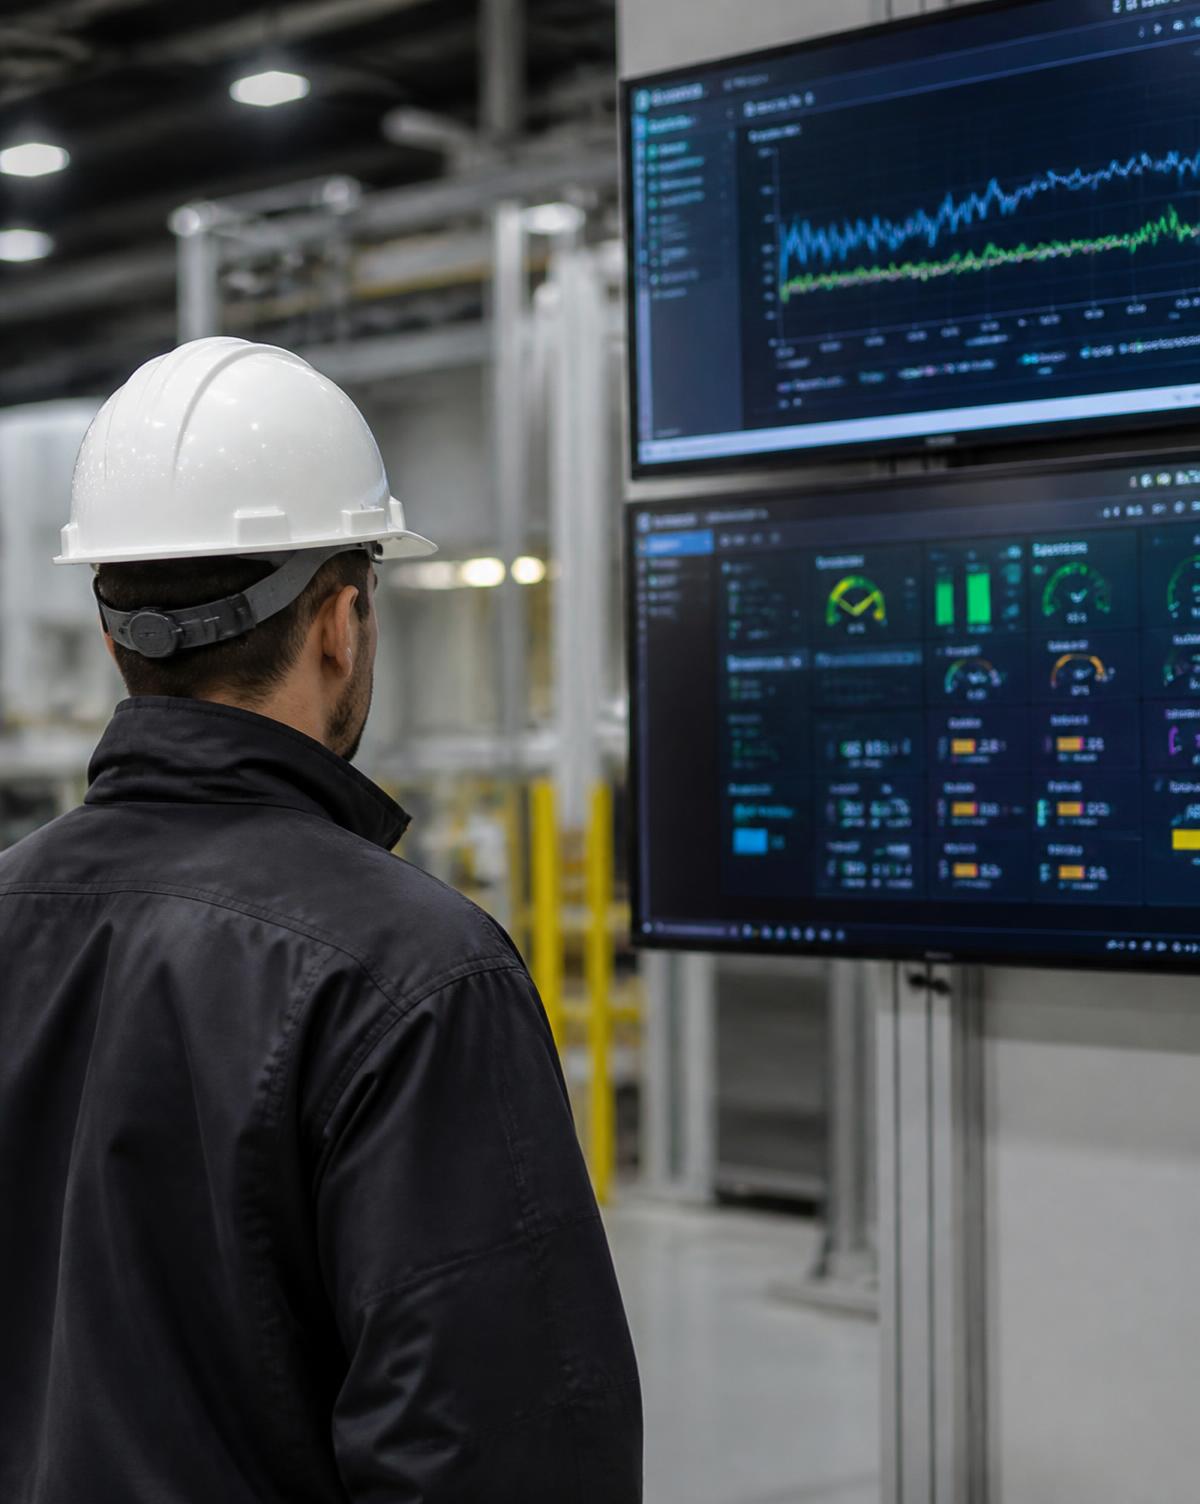
Real-time visibility
Live data from machines and sensors
Smart alerts
Detect anomalies early
Predictive service planning
Plan maintenance before failures
On-prem or cloud
Flexible deployment for your environment
Your advantage
Prevent failures before they stop production.
Maintenance used to be reactive: a machine failed, production halted, the team looked for a fix. Monitoring Booster reverses that pattern — technical signals become planning tools that support stable, efficient production.
Early anomaly detection
Spot the first signs of trouble in vibration, temperature or voltage data before they turn into a stoppage.
Custom alerts
Set warning and alarm thresholds for every asset, so the right team is notified at the right moment.
Condition visibility
See which parts wear out faster and under what conditions, and use that evidence when planning replacements.
Smarter maintenance planning
Schedule service exactly when it is needed instead of following a fixed calendar or waiting for a failure.
Less unplanned downtime
Reduce disruption and shorten reaction time by acting on real production signals, not after-the-fact reports.
Faster decisions
Give maintenance and production teams a clear operational picture, available instantly in one place.
Industrial challenges
Why manufacturers struggle without live monitoring.
70%
No real-time data access
Most companies still do not use live machine data, which delays every technical and production decision.
+40%
Time-consuming reporting
Manual report preparation extends the analysis process and burdens already stretched technical teams.
Siloed
Scattered information
Machine, sensor and IT system data live apart, making root causes and correlations hard to identify.
10×
Unplanned downtime
Unplanned stoppages can cost up to ten times more than scheduled maintenance of the same equipment.
How it solves the problem
One view of production. Action before failure.
Instead of reacting after a breakdown, schedule maintenance on real production signals.
Complete production overview
Data from machines, sensors and systems is centralized into one consolidated view of operations.
Data-driven decisions
Real-time and historical readings let teams make informed technical decisions without guesswork.
Act before problems escalate
The system raises alerts at the first sign of deviation, so maintenance can be scheduled proactively.
Flexible architecture
Start with a single dashboard and scale across lines, plants or locations at your own pace.
Seamless integration
Monitoring Booster uses OPC Gateway — no PLC interference and no costly infrastructure changes.
IT stability and security
The solution runs on-premises or in the cloud, aligned with your company security policies.
Trusted architecture
Grafana-based monitoring built for industrial reality.
A proven, open and scalable architecture using industry-leading technologies — with no costly infrastructure changes and deployment aligned with your IT policy.
01
Data sources
Machines, sensors, applications and OT/IT systems feeding the platform.
02
Connectivity layer
OPC Gateway moves machine data to IT systems without touching PLC logic.
03
Telemetry & storage
Prometheus and OpenTelemetry collect, store and standardize metrics.
04
Monitoring layer
Grafana dashboards, alerts, trends and reports for every team.
05
Operational outcome
Predictive maintenance decisions taken on real production evidence.
4D Methodology
From problem to growth direction
Discovery
Understanding the DNA of the problem before the first line of code is written. Discovery helps us explore the real business requirements, user needs, and technology context.
Key deliverable
Standardized Concept Document
Our activities
- Defining objectives
- Identifying the problem
- User research
- Competitive analysis
- Feasibility study
- Technical requirements
Our experience
- We act as a partner, not just a contractor
- Rapid identification of real business needs
- Experience in industrial and enterprise projects
- Early analysis of risks and constraints
What you gain
Real operational value, not just more data.
- 01
Live data instead of delayed reports
Current information exactly when it matters, not days after the event.
- 02
Maintenance planned on real signals
Service at the right time, based on asset condition rather than a calendar.
- 03
Automated monitoring and reporting
Less manual work for technical teams and more focus on action.
- 04
A solution tailored to your plant
Configured for your assets, processes and business goals.
- 05
A stable, scalable architecture
Ready to expand line by line, plant by plant, toward further automation.
- 06
Technical and strategic support
Our engineers stay involved at every stage of the project.
Where it is used
From intuition to data-driven operations.
Assembly lines and CNC
Manufacturing sites where machine availability defines output.
Automotive and heavy industry
Automotive, aerospace and heavy industry maintenance teams.
Energy and FMCG
Sectors where consumption and continuity are closely monitored.
Series production
Operations where consistency and quality are critical.
FAQ
Questions we hear most.
What exactly does Grafana monitoring offer and why is it helpful in production?
Grafana Monitoring provides a centralized, visual interface for real-time monitoring of metrics across machines, infrastructure and applications. Instead of dealing with fragmented data sources, you get a unified view that enables immediate detection of system load, performance issues or potential failures — full transparency across your production process.
What are the advantages of Grafana compared to other monitoring tools?
Grafana stands out for its flexibility, high scalability and intuitive interface, including interactive dashboards and custom visualizations. It is open source, easily extendable via plugins and supports Unified Alerting as a centralized alert management system, so it often outperforms commercial tools in efficiency and adaptability.
How does Grafana integrate with our existing systems?
We begin with a workshop to identify your requirements and use cases. Then, following our 4D model, we connect Grafana to your data sources — such as Prometheus, InfluxDB or log files — and build dashboards and alert rules. The goal is seamless integration into your existing IT/OT environment.
What can we expect during the introductory workshop?
During the workshop you learn the basics of Grafana: connecting data sources, creating dashboards, setting up alerts and modeling use cases. If needed, we also run a short demo or connect your pilot data, so the learning is hands-on and immediately useful.
What are the technical requirements?
You need a data source such as Prometheus, InfluxDB or logs from your production environment, a stable network connection and a server (local or cloud-based). In some cases a metric collection agent, for example Prometheus Node Exporter, or a log aggregator may also be required.
Do you assist with defining dashboards and relevant KPIs?
Yes. We work with you to define key metrics such as system load, response times and error rates, and design dashboards that provide the most value. On request we set threshold alerts, configure notifications and help interpret results in a business or production context.
How do you ensure data security and compliance?
Grafana supports role-based access control, secure authentication and optional encryption. We make sure sensitive data stays local or under your control, and we involve your IT department from the planning stage to align with compliance requirements and internal policies.
How can we prepare our teams to use the solution?
We offer hands-on training for both IT and production teams — from the basics to building dashboards independently. We also support the change process with communication, documentation, operating instructions and feedback rounds.
When is Grafana especially beneficial?
It is especially useful where full visibility of production processes, fast error detection, resource optimization and process monitoring are critical. Clients use it for predictive maintenance, production control and energy or resource usage analysis, often complementing internal control centers or MES systems.